
Hotel Marketing KPIs to Streamline Spending & Earn More

By: Frank DePino | May 20, 2026
Loading the Elevenlabs Text to Speech AudioNative Player...
Hotel marketing KPIs show whether your marketing is bringing profitable bookings, not just traffic or filled rooms, while supporting better tracking hotel marketing performance across channels.
The right KPI set helps hotel owners, revenue managers, and marketing teams decide where to increase spend, where to cut waste, and how to improve overall hotel marketing performance metrics.
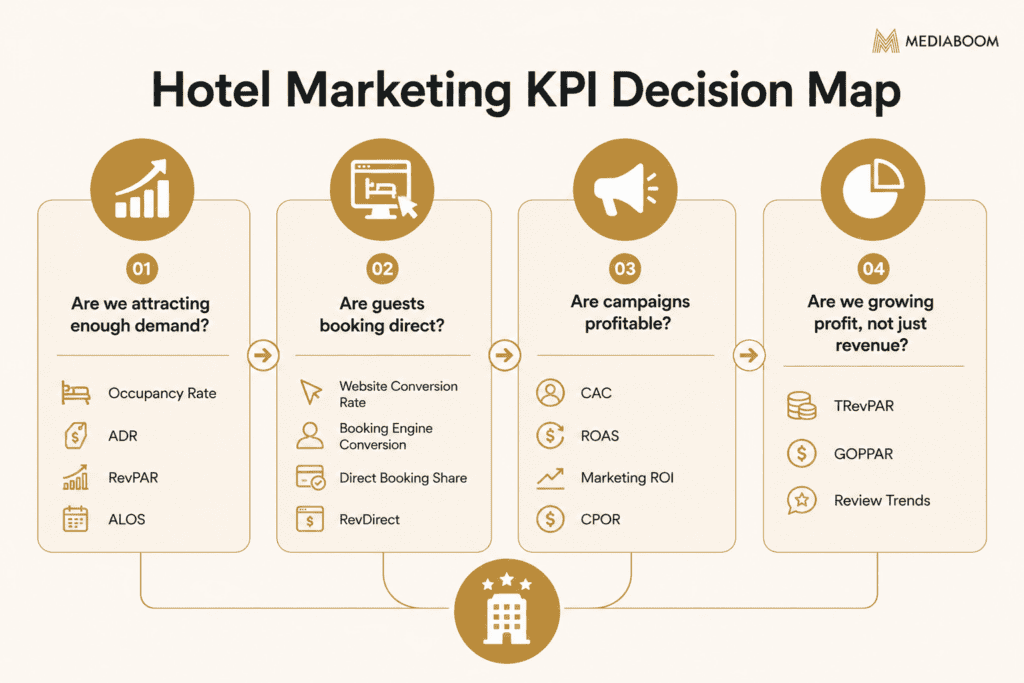
A practical hotel KPI report should answer four questions:
| Question | KPIs to Check |
| Are we attracting demand? | Occupancy Rate, ADR, RevPAR, ALOS |
| Are guests booking direct? | Website Conversion Rate, Booking Engine Conversion, Direct Booking Share |
| Are campaigns profitable? | CAC, ROAS, Marketing ROI, CPOR |
| Are we growing profit, not just revenue? | TRevPAR, GOPPAR, Review Trends |
Key takeaways:
- Hotel marketing KPIs connect marketing efforts to bookings, revenue generated, guest experience, and profitability, forming the foundation of online marketing KPIs hotel teams rely on.
- Occupancy rates alone are not enough. Pair them with ADR, RevPAR, TRevPAR, and GOPPAR to understand demand, pricing, total revenue, and profit.
- Website and booking-funnel KPIs matter because hotels can lose direct bookings before guests finish the reservation process.
- Paid media KPIs like CAC, ROAS, and marketing ROI show whether campaigns are bringing profitable guests or only increasing spend.
- Benchmarks matter. A 60% occupancy rate can be strong in one market and weak in another.

What Are Hotel Marketing KPIs?
Hotel marketing KPIs are measurable values that show how well a hotel’s marketing, booking channels, and revenue activity are performing.
These KPIs help hotel management see which marketing campaigns bring qualified traffic, which channels turn visitors into guests, and which efforts support stronger revenue through accurate tracking hotel marketing performance.
Instead of judging performance by bookings alone, hotel teams can connect traffic, conversion rate, guest acquisition cost, revenue per available room RevPAR, and guest experience data.
The best KPIs for hotel marketing answer practical questions:
- Are we attracting enough demand?
- Are more guests booking direct?
- Are paid campaigns profitable?
- Is our website turning visitors into reservations?
- Are we growing revenue without hurting margin?
- Are guests satisfied enough to return or leave positive reviews?
Hotel-wide KPIs and marketing-specific KPIs are connected, but they are not the same.
| KPI Type | What It Shows | Examples |
| Hotel-wide KPIs | Overall business and revenue health | Occupancy Rate, ADR, RevPAR, TRevPAR, GOPPAR |
| Marketing KPIs | How well marketing turns demand into bookings | Website Conversion Rate, CAC, ROAS, Direct Booking Share |
| Guest KPIs | How guest experience affects loyalty and demand | Review Rating Trend, Review Volume, Repeat Guest Rate |
A small hotel does not need dozens of reports to start tracking hotel marketing performance.
A practical first dashboard can include occupancy, ADR, RevPAR, website conversion rate, direct booking share, CAC, ROAS, and review trends as core hotel marketing metrics.
Read these KPIs together. Higher occupancy can still be weak if ADR drops, acquisition costs rise, or guests come through high-commission channels.
Is Your Hotel Showing Up in ChatGPT?
Travelers are increasingly using AI tools to research destinations before they ever reach a booking site. See how your hotel appears in these AI-generated answers, where competitors or OTAs may be gaining visibility, and whether there are opportunities to strengthen your presence.
Which Hotel Marketing KPIs Matter Most?
The most useful hotel marketing KPIs fall into five groups: revenue and demand, direct booking performance, paid media, profitability, and guest retention. Grouping them this way makes the data easier to act on.
Which revenue and demand KPIs should hotels track?
Revenue and demand KPIs show whether the hotel is attracting guests, pricing rooms well, and turning available inventory into revenue using clear hotel marketing performance metrics.
| KPI | Formula | What It Tells You | What To Do Next |
| Occupancy Rate | Occupied Rooms ÷ Available Rooms × 100 | Measures the percentage of available rooms sold | If low, review demand, pricing, seasonality, and channel mix |
| Average Daily Rate ADR | Total Room Revenue ÷ Rooms Sold | Measures the average rate paid for occupied rooms | If low, review rate strategy, packages, and discounting |
| RevPAR | ADR × Occupancy Rate, or Room Revenue ÷ Available Rooms | Measures room revenue per available room | If flat, check whether occupancy or ADR is limiting growth |
| ALOS | Total Occupied Room Nights ÷ Number of Bookings | Measures average length of stay | If short, test packages, event offers, and longer-stay incentives |
RevPAR is one of the most common hotel performance metrics because it connects occupancy and ADR into one room revenue figure.
The main mistake is reading any one of these metrics alone. Occupancy can rise because rates were cut too deeply. ADR can rise while occupancy falls. RevPAR helps connect the two, but it still does not show total property revenue or profit.
Which direct booking and website KPIs should hotels track?
Direct booking KPIs show how well your website and booking flow turn demand into reservations and support online marketing KPIs hotel teams use to measure funnel performance.
Track these online marketing KPIs hotel teams often miss:
- Website Conversion Rate: the percentage of website visitors who complete a booking.
- Visitor to Booking Engine Conversion: the percentage of site visitors who start a booking engine search.
- Booking Engine to Booking Conversion: the percentage of booking engine users who complete a reservation.
- Direct Booking Share: the percentage of total bookings that come from direct channels.
- RevDirect: direct-channel revenue per available room.
HSMAI Europe defines Visitor to Booking Engine conversion as the percentage of website visitors who search in the booking engine, and notes that hotel Visitor to Booking Engine conversion often ranges from 35% to 55%.
It also defines Booking Engine to Booking conversion as the share of booking engine users who complete a stay, with common rates often around 5% to 15%.
These two numbers matter because they show different problems.
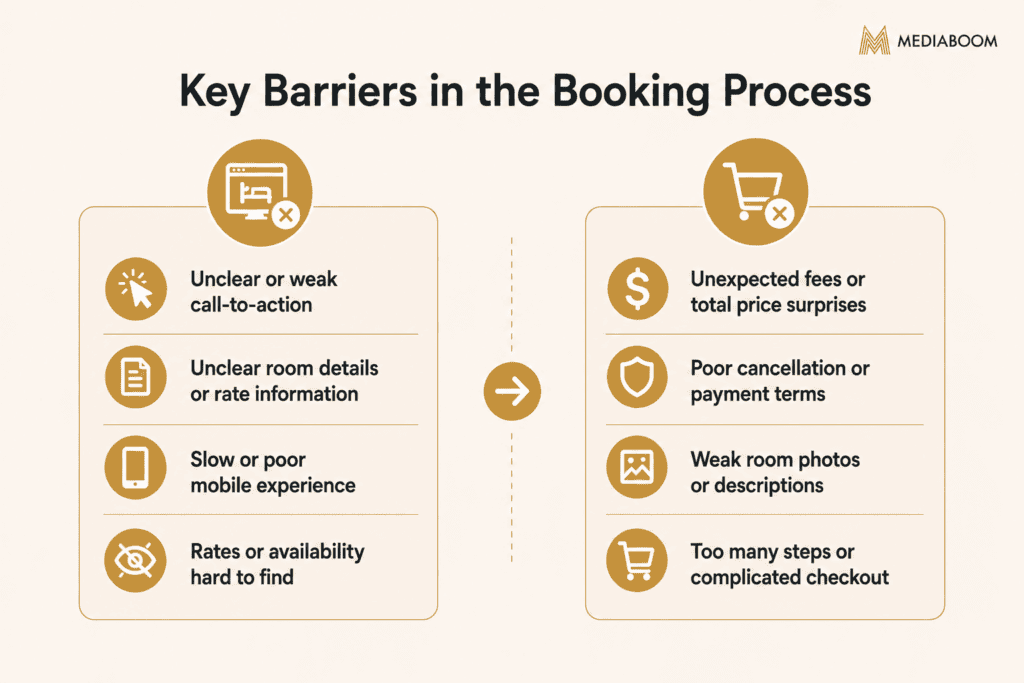
If visitors do not enter the booking engine, the website may have weak calls to action, poor rate visibility, unclear room pages, or slow mobile performance.
If users enter the booking engine but do not book, the issue may be rate competitiveness, hidden fees, poor room photos, weak cancellation terms, or a booking engine that feels difficult to use.
Which paid media and acquisition KPIs should hotels track?
Paid media KPIs show whether ad spend is creating profitable bookings or only adding cost, making them essential hotel marketing metrics for campaign evaluation.
Track these KPIs:
- Customer Acquisition Cost CAC: Total Marketing Spend ÷ New Bookings Acquired
- Return on Ad Spend ROAS: Revenue Attributed to Ads ÷ Ad Spend
- Marketing ROI: Net Return from Marketing ÷ Marketing Cost × 100
- Cost Per Occupied Room CPOR: Operating or marketing cost tied to occupied rooms
- Brand vs Non-Brand Paid Search Split: separates existing demand from new demand
ROAS is useful, but it should not be the only paid media KPI. A campaign can show strong ROAS while still relying too much on brand searches, discount-heavy bookings, or room nights with weak margin.
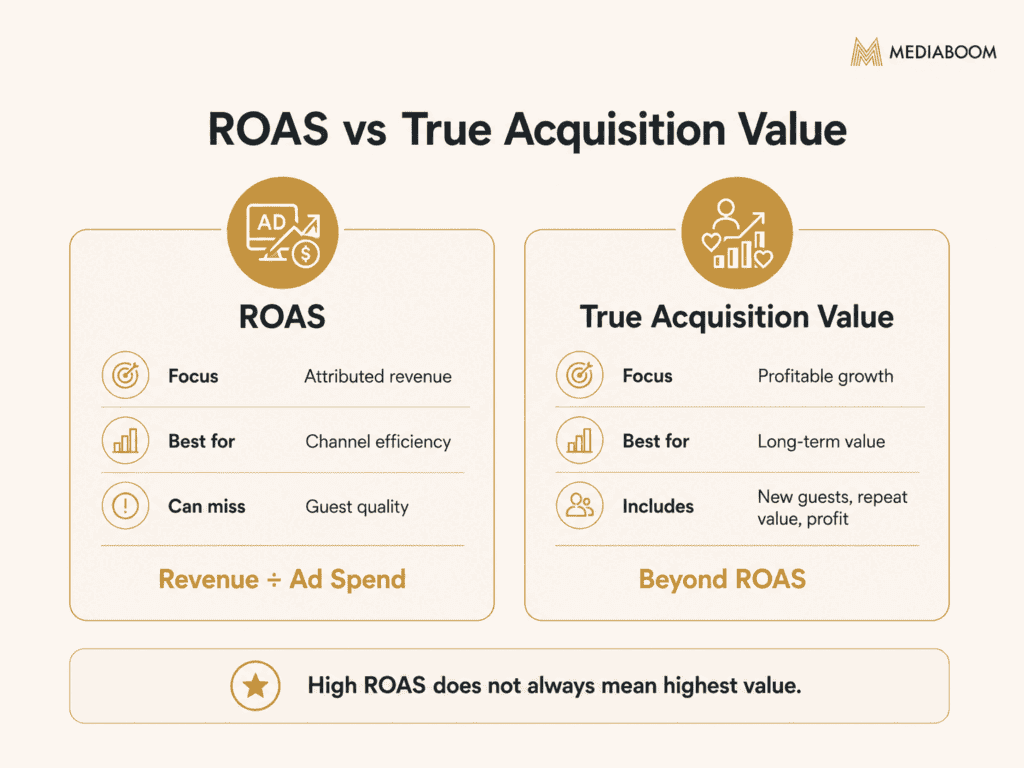
CAC helps answer a more direct question: how much does it cost to win each booking?
Use ROAS to judge ad return. Use CAC to judge acquisition cost. Use GOPPAR or margin data to judge whether the booking was truly profitable.
Which profitability KPIs should hotels track?
Profitability KPIs show whether revenue growth is actually helping the business.
The two most important are:
- TRevPAR: Total Revenue Per Available Room
- GOPPAR: Gross Operating Profit Per Available Room
RevPAR only looks at room revenue. TRevPAR adds total hotel revenue, such as spa, restaurant, parking, resort fees, event space, and other on-property spend. GOPPAR goes one step further by factoring in operating profit.
Cloudbeds explains TRevPAR as total revenue divided by total available rooms, which makes it useful for properties with meaningful non-room revenue. Priority Software also notes that GOPPAR adds expenses into the picture, while RevPAR and ADR focus on revenue.
This distinction matters for hotel marketing. A campaign that brings guests who spend more on property may be more valuable than a campaign that only fills rooms at a low rate.
Which guest retention and reputation KPIs should hotels track?
Guest retention and reputation KPIs show whether the guest experience is helping or hurting future demand.
Track these metrics:
- Review Rating Trend
- Review Volume Trend
- Repeat Guest Rate
- Email List Growth
- Post-Stay Survey Response Rate
- Loyalty or Return Guest Revenue, if available
Reviews matter because hotel shoppers compare trust signals before booking. BrightLocal’s 2024 Local Consumer Review Survey notes that Tripadvisor remains closely tied to hospitality and entertainment reviews.
Do not track reviews only as a reputation task. Review trends can point to product issues, staffing issues, room quality concerns, service gaps, or strong guest experience themes that should appear in hotel marketing.
How Do You Calculate Hotel Marketing KPIs Correctly?

Hotel marketing KPIs should use consistent formulas, date ranges, and revenue sources, or the report will lead to bad decisions.
Use these formulas as a clean starting point:
| KPI | Formula |
| Occupancy Rate | Occupied Rooms ÷ Total Available Rooms × 100 |
| ADR | Total Room Revenue ÷ Rooms Sold |
| RevPAR | ADR × Occupancy Rate, or Total Room Revenue ÷ Total Available Rooms |
| ALOS | Total Occupied Room Nights ÷ Number of Bookings |
| TRevPAR | Total Hotel Revenue ÷ Total Available Rooms |
| GOPPAR | Gross Operating Profit ÷ Total Available Rooms |
| CAC | Total Marketing Spend ÷ New Customers or Bookings Acquired |
| ROAS | Revenue Attributed to Ads ÷ Ad Spend |
| Website Conversion Rate | Website Bookings ÷ Website Sessions × 100 |
| Direct Booking Share | Direct Bookings ÷ Total Bookings × 100 |
Cloudbeds and Mews both describe common hotel KPI formulas such as occupancy rate, ADR, RevPAR, TRevPAR, GOPPAR, and ALOS.
Common formula mistakes include:
- Confusing RevPAR with full-capacity revenue
- Reading ADR without occupancy
- Using room revenue when the question is total hotel revenue
- Mixing marketing spend with total operating costs
- Comparing one channel’s gross revenue against another channel’s net revenue
- Using different attribution windows across Google Ads, GA4, and the booking engine
The best fix is to document each KPI formula in the dashboard. If two people can calculate the same KPI and get different answers, the reporting system is not clear enough.
WHAT OUR CLIENTS SAY
RevPAR vs TRevPAR vs GOPPAR: Which Metric Should Hotels Use?
Hotels should not choose only one of these metrics. RevPAR, TRevPAR, and GOPPAR answer different business questions.
| Metric | Best For | Trade-Off | Avoid Using Alone If |
| RevPAR | Room revenue performance | Does not include non-room revenue or costs | Your hotel has large spa, dining, parking, event, or resort revenue |
| TRevPAR | Total property revenue performance | Still does not show profit | Operating costs vary heavily by channel or guest type |
| GOPPAR | Profit-focused performance | Requires reliable cost data | Your financial reporting is incomplete or inconsistent |
RevPAR is helpful when the question is, “How well are we turning rooms into revenue?”
TRevPAR is better when the question is, “How much total revenue does the property generate per available room?”
GOPPAR is best when the question is, “Are we making more profit, not just more revenue?”
For example, a luxury hotel may bring in lower room revenue from one package but stronger total spend from spa, dining, and experiences. RevPAR may understate the value of that campaign. TRevPAR and GOPPAR provide a clearer view.

How Do Hotel Marketing KPIs Help You Cut Wasted Spend?
Hotel marketing KPIs cut wasted spend by showing which channels, campaigns, and booking paths produce profitable revenue.
Use these rules:
| If You See This | Check This Next | Likely Issue |
| Traffic rises but bookings do not | Website Conversion Rate and Visitor to Booking Engine | Weak landing pages, poor mobile UX, unclear booking CTA |
| Paid bookings rise but profit does not | CAC, ROAS, GOPPAR | Acquisition cost is too high |
| Occupancy rises but ADR falls | ADR, RevPAR, channel mix | Too much discounting |
| RevPAR rises but GOPPAR falls | Costs, channel fees, guest spend | Revenue growth is not translating into profit |
| Direct booking share falls | OTA mix, booking engine conversion, metasearch | Guests are finding you but booking elsewhere |
| Review trend drops | Review themes, repeat guest rate, branded search | Guest experience may hurt future demand |
If occupancy is strong but ADR is weak, do not celebrate too early. Review whether the hotel is buying occupancy through discounts, OTA dependence, or low-margin packages.
If paid search brings traffic but few direct bookings, do not only adjust bids. Check the landing page, rate display, booking engine path, and mobile load speed.
What Common KPI Mistakes Lead to Bad Hotel Marketing Decisions?
The most common mistake is tracking numbers without tying them to decisions.
Avoid these KPI mistakes:
- Tracking too many KPIs with no weekly action
- Focusing on occupancy alone
- Treating all bookings as equal
- Ignoring booking engine drop-off
- Ignoring mobile performance
- Ignoring channel costs and OTA commissions
- Reading RevPAR without TRevPAR or GOPPAR
- Using weak attribution between ads, GA4, PMS, and the booking engine
- Comparing mismatched date ranges
- Reacting to one-day swings instead of trends
Another common issue is giving every channel the same value. A direct booking, OTA booking, group booking, and paid search booking may all fill a room, but they do not carry the same cost, margin, or guest value.
Mews notes that hotel KPIs help teams understand revenue sources, guest segments, and operational performance, not just topline room numbers.
FAQs About Hotel Marketing KPIs
What are the most important hotel marketing KPIs?
The most important hotel marketing KPIs usually include occupancy rate, ADR, RevPAR, website conversion rate, booking engine conversion, direct booking share, CAC, ROAS, TRevPAR, GOPPAR, and review trends. The best KPI set depends on whether the hotel is trying to grow occupancy, direct bookings, total revenue, or profit.
What is a good hotel website conversion rate?
A good hotel website conversion rate depends on brand demand, market, device mix, rate competitiveness, and booking friction. HSMAI Europe notes that hotel direct-channel funnel tracking should include Visitor to Booking Engine and Booking Engine to Booking conversion, with typical ranges of 35% to 55% and 5% to 15% respectively.
What is the difference between Visitor to Booking Engine and Booking Engine to Booking?
Visitor to Booking Engine measures how many website visitors start a booking search. Booking Engine to Booking measures how many booking engine users finish a reservation. Hotels should track both because each one reveals a different funnel problem.
Is RevPAR enough to judge hotel marketing performance?
No, RevPAR is not enough by itself. RevPAR shows room revenue per available room, but it does not show total hotel revenue, operating costs, acquisition cost, or direct-channel strength. Use it with TRevPAR, GOPPAR, CAC, ROAS, and direct booking share.
How often should hotels review marketing KPIs?
Hotels should review core marketing KPIs weekly, with daily checks during high season, active campaigns, or sudden demand changes. Weekly review is usually enough to spot trends, while daily review helps teams react when paid media spend, rates, or occupancy move quickly.
Which KPI best shows whether OTA reliance is too high?
Direct booking share is the clearest starting point for measuring OTA reliance. Hotels should also compare direct-channel conversion, acquisition cost, and RevDirect so they know whether direct bookings are growing profitably.
Should small hotels track the same KPIs as large hotels?
Small hotels can start with fewer KPIs. A practical first set includes occupancy, ADR, RevPAR, website conversion rate, direct booking share, CAC, ROAS, and review trend. Larger hotels may need deeper reporting by segment, room type, market, and outlet revenue.
Why do review trends belong in a hotel KPI article?
Review trends belong in hotel marketing KPIs because they affect guest trust, search behavior, and booking decisions. Track both review rating and review volume, then compare the trend with direct bookings, branded search, repeat guests, and guest feedback.
Next Steps for Tracking Hotel Marketing KPIs
Start with a focused KPI set before building a large report.
- Pick 8 to 12 KPIs: Include occupancy, ADR, RevPAR, website conversion rate, direct booking share, CAC, ROAS, TRevPAR, GOPPAR, and review trend.
- Write down each formula: Make sure the hotel team, agency, PMS, booking engine, and analytics tools use the same definitions.
- Separate channels: Break out direct, OTA, paid search, metasearch, email, organic search, and social where possible.
- Compare against context: Review performance by season, market, device, and channel.
- Assign one action per weak KPI: A KPI without a next step is only a report number.
- Review weekly: Keep the dashboard short enough that the team can actually use it.
Elevate Your Hospitality Brand Today
Schedule Your Free Consultation
Seeking to elevate your business? Let Mediaboom guide you. Secure your exclusive, free consultation with our digital marketing experts today.
Conclusion
Hotel marketing KPIs should do more than report activity. They should show which channels drive bookings, which campaigns waste budget, where the booking funnel is weak, and whether the hotel is growing profit.
The strongest reporting system connects traffic, bookings, revenue, cost, and guest experience to improve tracking hotel marketing performance across all channels.
When those numbers are reviewed together, hotel teams can make better decisions about pricing, paid media, direct bookings, content, and channel mix.
Want a clearer view of which channels drive bookings, which ones waste budget, and which KPIs deserve weekly attention?
Talk with Mediaboom about a hotel marketing audit and reporting setup built around direct revenue, paid media performance, and hotel profitability.
By: Frank DePino
Frank DePino is the Principal and Founder of Mediaboom, a top hotel marketing agency partnering with leading hotel and hospitality brands. With 30+ years of experience, he has led strategic digital initiatives for names including Four Seasons, Ritz-Carlton, JW Marriott, Millennium Partners, and Guardian Jet. Frank helps hospitality businesses strengthen brand presence, drive qualified leads, and elevate guest experiences through website design, SEO, content marketing, and paid media. Under his leadership, Mediaboom is a trusted partner for brands pursuing measurable digital growth in a competitive hospitality landscape.